Welcome to the EYESEE Solution support
Customer report
Choosing a date and validating the form displays, for the selected date range, the percentage of ‘pallet’ locations visited for the chosen depot, as well as each activated zone and face of this depot.

More in detail:
- Selection: A period is required and a warehouse must be selected. It is possible to delete selections.
- Period: Date or period to be typed in or selected from the calendar. Minimum date: 1/1/2022. Maximum date: same day.
- Repositories: You can select a repository.
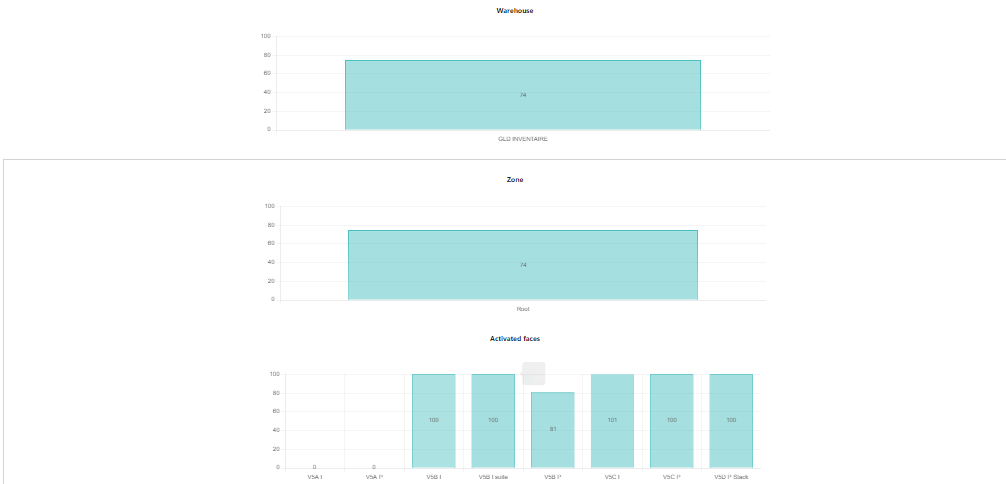
- Graphs: A number of graphs will be displayed, showing the progress of the inventory for :
- The chosen depot ;
- Each zone containing activated faces;
- Below the graph for each zone, the graphs for all activated faces.
- PDF : The first page contains a summary of various data:
- Selected period
- PDF export date
- The user who generated the report
- The company
- The selected depot
- The list of faces inspected in this depot
- A summary of the executions with included:
- The number and percentage of pallet locations inventoried;
- An estimate of the number of pallet locations inventoried at this rate;
- The number of inventories per pallet location per year at this rate.
The other pages contain graphics of the zones and faces.

